
Simon Glairy is a visionary in the insurance technology space, specializing in how high-resolution imagery and artificial intelligence are fundamentally reshaping our understanding of environmental risk. With an extensive background in risk management and AI-driven assessment, he has pioneered methods to move the industry beyond archaic, broad-brush geographic modeling. His work emphasizes the transition from reactive claims handling to proactive risk mitigation, ensuring that technology serves both the insurer’s bottom line and the policyholder’s peace of mind.
The following discussion explores the shift from broad ZIP-code modeling to precise individual property scoring and the technical integration of visual data into actuarial metrics. We also examine the ethical management of geospatial privacy, the role of parametric triggers in fostering community resilience, and how continuous monitoring is redefining long-term client retention in an era of climate volatility.
How does moving from broad ZIP code-level assessments to individual property analysis change your underwriting capacity? Could you explain the specific steps for identifying insurable risks in previously avoided zones and the impact this precision has on overall portfolio growth?
Traditionally, underwriters looked at a ZIP code and saw a monolithic wall of risk, which often led to declining coverage for everyone in that specific area. By drilling down into individual property levels with geospatial data, we can see the nuances that were previously invisible to older models. For instance, if you have 1,000 properties in a specific ZIP code that were all considered high-risk, a closer look might reveal that only 870 are actually exposed to the hazard. This precision allows us to confidently write policies for the remaining 130 risks that we would have otherwise walked away from. It turns a categorical “no” into a data-backed “yes,” expanding the portfolio while maintaining a sophisticated, granular grasp on actual exposure.
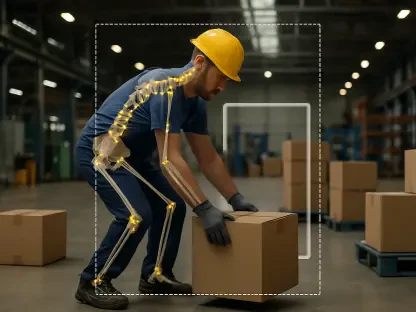
Timestamped photos can reveal subtle shifts in landscape vegetation or property perils over time. How do you integrate these visual indicators into actuarial KPIs, and what specific metrics do you use to ensure these observations meaningfully influence the bottom line?
The real breakthrough happens when we translate a simple photo showing encroaching brush or a degrading roof into a concrete actuarial KPI. We use these timestamped images to score the frequency and severity of potential risks, creating a bridge between visual change detection and financial forecasting. Without this translation, a high-resolution satellite image is just a “nice to have” visual rather than a tool for a hard business decision. We look for specific indicators of risk reduction or increase over a 12 to 24-month period to see how a property’s profile has truly evolved. By quantifying these shifts, we ensure that every pixel processed contributes directly to the stability and profitability of the underwriting results.
Collecting and standardizing geospatial data involves navigating complex privacy and regulatory hurdles. What practical strategies are effective for aligning this raw data with existing underwriting standards, and how do you maintain data privacy while scoring individual property risks?
Navigating the sea of raw geospatial data requires a disciplined approach to standardization so that the information can actually fit into existing underwriting standards and regulatory frameworks. We must carefully balance the hunger for granular detail with the absolute necessity of maintaining individual privacy throughout the scoring process. One effective strategy is to focus on objective property characteristics—such as flood heights, vegetation density, or roof integrity—rather than personal identifiers. This ensures that the risk scores we generate are compliant and ethically sourced while still providing the precision needed for modern risk assessment. It is a constant cycle of collecting, standardizing, and refining to ensure the data is as useful as it is protected from misuse.
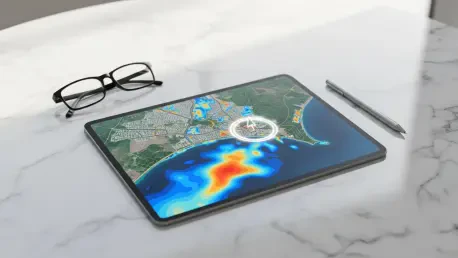
Parametric policies often rely on flood gauge measurements and photographic verification to trigger payouts. Beyond rapid claims, how can this data be used for targeted risk mitigation in high-exposure neighborhoods, and what steps are necessary to build community trust in these automated systems?
In places like the Eastwick neighborhood in Philadelphia, parametric policies are changing the conversation from simple compensation to proactive community resilience. By using flood gauge measurements confirmed with photos, we provide a transparent and undeniable trigger for payouts that bypasses the traditional, often agonizing claims process. This same data can be shared with community members and NGOs to identify exactly where the water hits hardest, allowing for smarter, targeted infrastructure investments. Building trust requires this level of transparency; when a community sees that the sensors and photos lead to fair, rapid support without the usual red tape, the automated system stops being a “black box” and starts being a reliable partner.
Continuous monitoring allows insurers to track property changes every 12 to 24 months rather than dropping clients during renewals. How does this ongoing data flow improve client retention, and could you share an example of how alerting a policyholder to a specific change saved a relationship?
The old model of underwriting a property once and then potentially dropping the client a year later is incredibly inefficient and damaging to long-term customer loyalty. By monitoring properties every 12 to 24 months, we can identify properties that actually have less risk today than they did two years ago. Instead of a cold renewal or a sudden cancellation notice, we can reach out to a policyholder to alert them to meaningful changes in their risk profile. This proactive communication transforms the insurer from a distant bill collector into a vital risk advisor, which is essential for keeping clients for the long haul. When you can tell a homeowner exactly how to mitigate a new peril detected by imagery, you aren’t just protecting an asset; you are securing a lifelong professional relationship based on mutual benefit.
What is your forecast for the evolution of geospatial data in the insurance industry?
I believe we are moving toward a future where geospatial data allows us to expand our portfolios by finding creative, data-driven ways to say “yes” to more customers. We will see a shift where data that once signaled a reason to decline coverage is instead utilized for highly targeted risk mitigation strategies that help the customer stay insured. The industry will become much more adept at detecting area changes in real-time, allowing for a more fluid and responsive insurance market that reflects the world as it is today, not as it was five years ago. Ultimately, the successful insurers will be those who use these insights not just to avoid loss, but to empower their customers to actively manage and reduce their own exposure.